Architecture
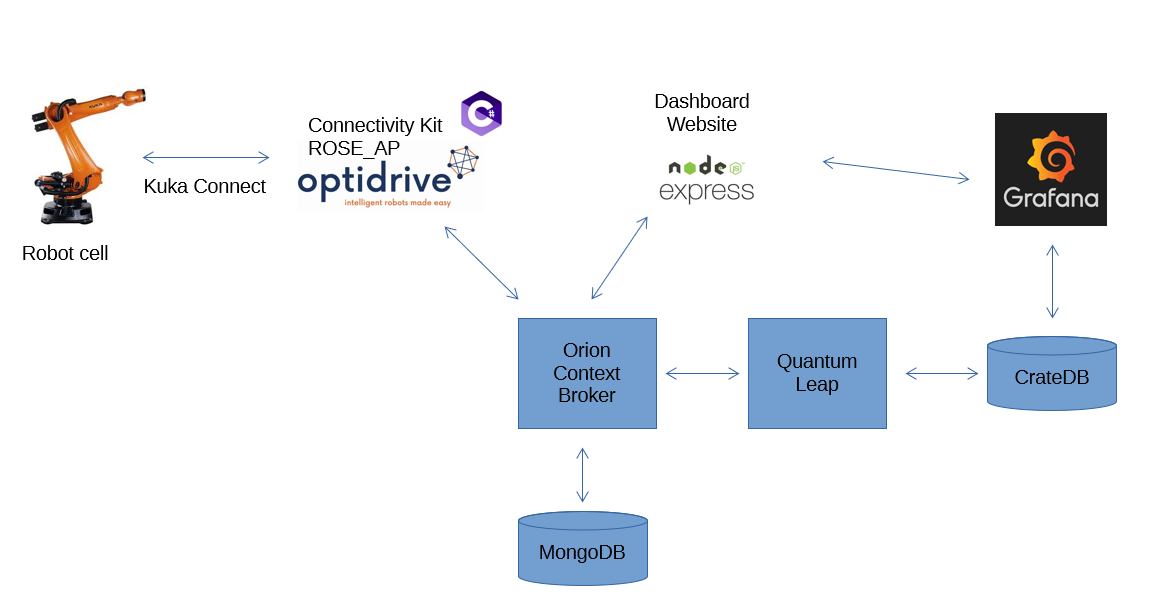
The user interface of our experiment is created in Grafana. All data on the dashboard is taken from a timebased database (cratedb) and is written into this database by the OCB.
- Dashboard:
- represents the state of the robot - on top you can select which robot you want to see - we show following data : state of the robot, state of vacuum, tool info, state of inputs and outputs
At this moment the deployment on the VTT server is limited to QuantumLeap, CrateDB and the OCB. Configuration of the datamodel and subscriptions are explained in the docker compose part.
The data models we use to communicate with the Orion Context Broker we try to realise following the NGSI. More info on the used data model can be found at https://github.com/smart-data-models/incubated/tree/master/DIH2/JS2SF